LMSR Prediction Market Robustness
Under what conditions do Logarithmic Market Scoring Rule (LMSR) prediction markets fail to aggregate information?
Contributors: Mark Song, Minghe Liu, Zhaohua Zheng
CSE 5106: Multi-Agent Systems \(|\) Spring 2026
Approach
We use a multi-agent simulation with controlled stress tests. Across reruns, we vary:
- noise intensity
- adversary strength
- informed-trader quality
- liquidity depth
- solvency structure
- defense mechanisms
We then measure how often, how badly, and how long the market deviates from the true probability.
Market Model
LMSR setup
- Outcome space: binary
- Ground-truth probability:
p* = 0.65 - Liquidity parameter:
b
Largerbmeans deeper liquidity and less price impact per trade. - Trading horizon: 500 steps per run
- Pricing rule: standard LMSR share-cost geometry
Core equations
The binary LMSR cost function and positive-response price are:
Mispricing is measured by Bernoulli KL divergence:
Evaluation logic
final_kl— final KL divergence from truthp95_kl/p99_kl— tail mispricing during the runkl_spike_rate— share of time steps with severe mispricingrecovery_time_after_last_adversary_rolling— time to recover after adversarial pressure endstrade_fill_rate— executed orders / submitted orders
Informed-trader safety logic:
For the failure-boundary sweep, a run passes the realized-influence gate only if:
where a_s is adversary active duration, n_s its executed notional share, and r_s its trade acceptance ratio.
Threshold calibration
Failure thresholds were calibrated from healthy-control branches (scenario_no_adversary and scenario_tuned_recovery), not external benchmarks. The calibration pass selected:
final_kl ≤ 0.0072avg_kl_after_burn_in ≤ 0.0056p95_kl ≤ 0.0189kl_spike_rate ≤ 0.0000recovery_time_after_last_adversary_rolling ≤ 44.8trade_fill_rate ≥ 0.2576
Important correction: these values were saved for documentation and later tuning, but the sweeps below still used the thresholds embedded in the live configs.
Agent Families
The simulation includes 3 agent families and 10 concrete agent types.
Informational agents
- InformedAgent — trades on a noisy signal when belief and price differ enough
- DelayedInformedAgent — acts on lagged signals
- NoiseAgent — trades randomly
- RegimeSwitchNoiseAgent — alternates between calm and bursty noise
Behavioral agents
- MomentumAgent — follows recent price moves
- MeanReversionAgent — trades against recent moves
- HerdingTechnicalAgent — combines order flow and momentum into trend following
Adversarial agents
- AdaptiveAdversary — pushes toward a target distribution and adjusts intensity
- CollusiveAdversary — coordinates attack and rest phases across agents
- TriggerAdversary — attacks only when the market becomes exploitable
Experimental Design
The project has 4 complementary studies:
-
Multi-seed scenario suite
10 scenarios × 5 seeds = 50 runs -
Failure-boundary sweep
3 noise × 3 adversary × 3 informed-strength × 10 seeds = 270 runs -
Liquidity / solvency frontier
2 scenarios × 5 liquidity levels × 4 risk profiles × 5 seeds = 200 runs -
Defense-mechanism ablation
32 combinations × 10 seeds = 320 runs
Results
1. Scenario results
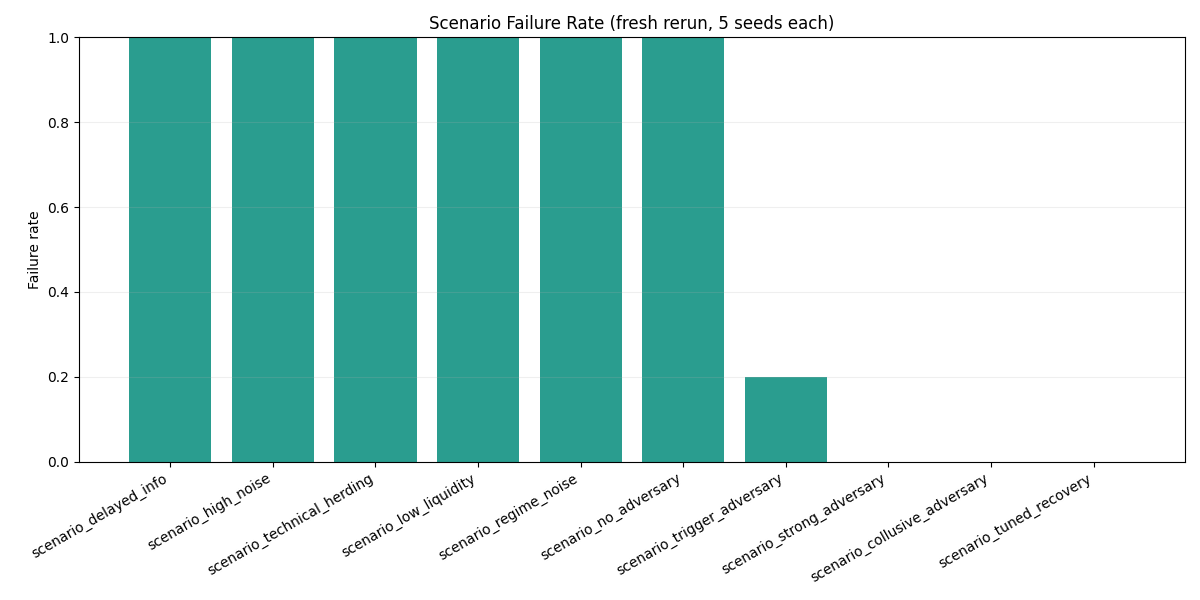
The 10-scenario suite split into three groups.
All-flagged group
delayed_infohigh_noisetechnical_herdinglow_liquidityregime_noiseno_adversary*
Partial-failure group
trigger_adversary—1 / 5seeds failed (failure_rate = 0.200)
Zero-failure group
strong_adversarycollusive_adversarytuned_recovery
Main takeaway:
The worst outcomes came not from the strongest adversaries, but from stale information, dominant noise, and endogenous technical feedback.
2. Tail risk
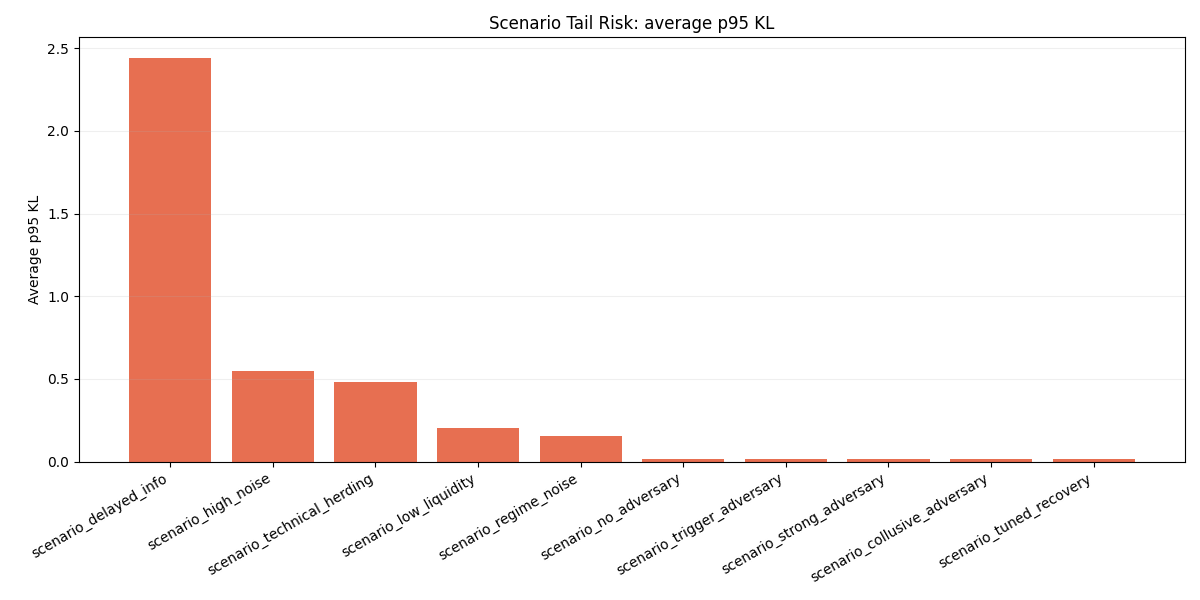
Delayed information produced the worst tail behavior.
Worst average p95_kl
- 2.4433 —
delayed_info - 0.5487 —
high_noise - 0.4837 —
technical_herding
delayed_info also showed the broadest failure signature:
final_klin2 / 5seedsp95_klin5 / 5seedskl_spike_ratein5 / 5seedsrecovery_time_after_last_adversary_rollingin5 / 5seedsstress_duration_after_burn_inin5 / 5seeds
3. Best-performing scenarios
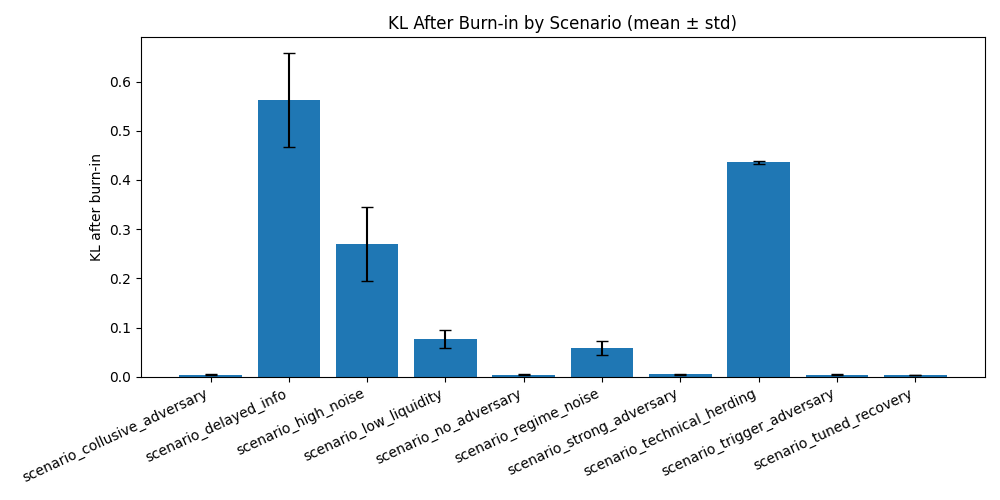
Several adversarial scenarios performed unexpectedly well.
Best average final KL
- 0.0003 —
trigger_adversary - 0.0020 —
tuned_recovery - 0.0029 —
collusive_adversary - 0.0071 —
strong_adversary
Best execution efficiency
- 0.6889 —
high_noise - 0.5960 —
low_liquidity - 0.5766 —
regime_noise
Control caveat: no_adversary
All five seeds were flagged as failures only because recovery_time_after_last_adversary_rolling is undefined when no adversary exists. Quantitatively, the control remained strong:
- avg final KL:
0.0037 - avg p95 KL:
0.0154
4. Two failure modes
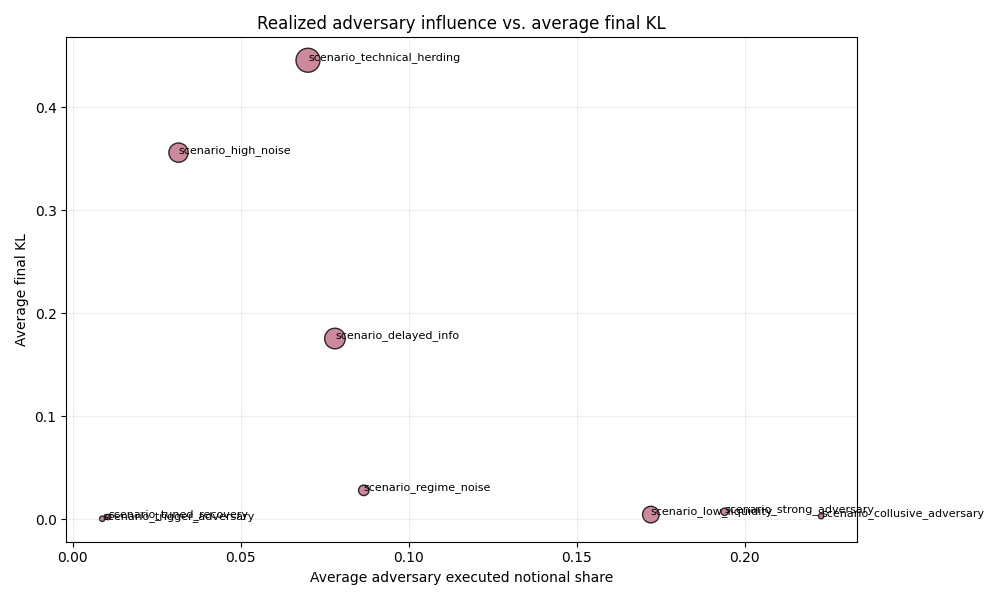
The project separates economic failure from true adversarial stress.
A. Economic failure, no dominance
High final KL with low realized adversary share. These failures are driven by:
- noise
- stale information
- weak informed order flow
B. True adversarial stress
The adversary is both:
- active
- economically influential
This category is much rarer than raw failure counts suggest.
Robustness is not just whether bad outcomes occur, but who causes them and through what mechanism.
5. Failure boundary
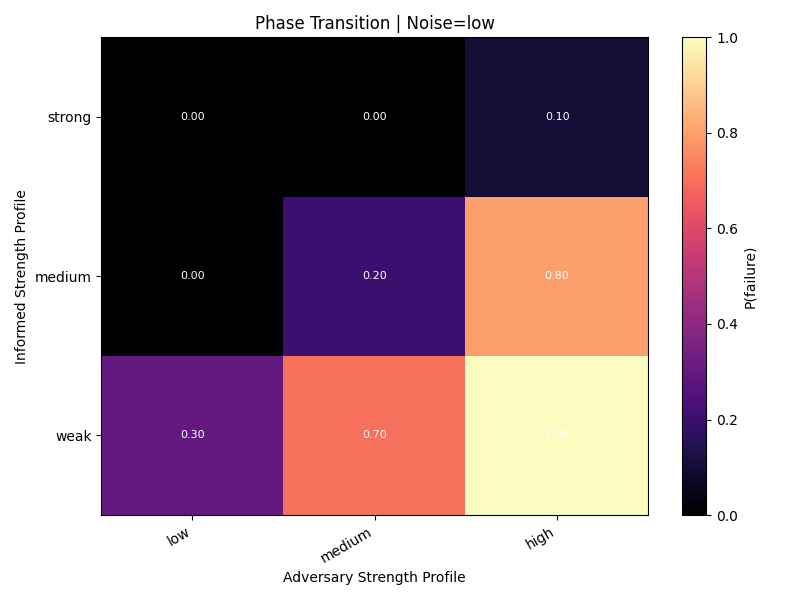
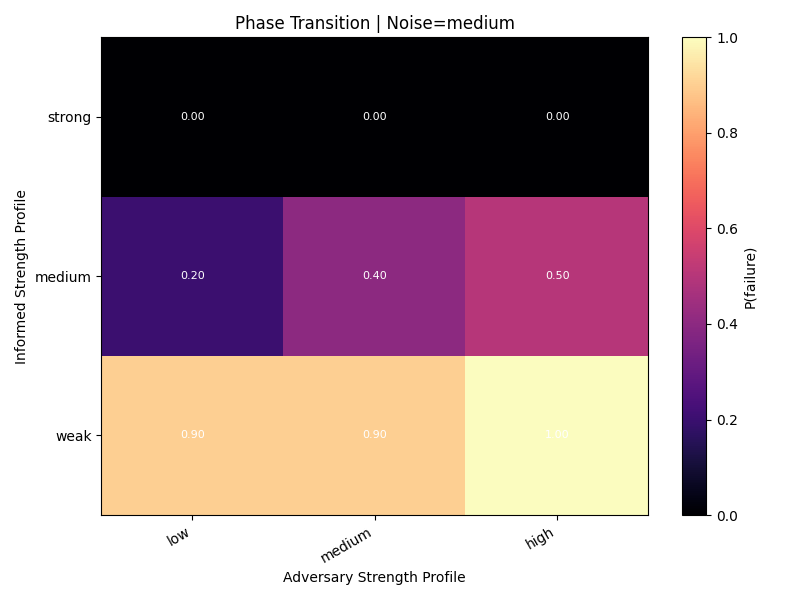
Noise creates a sharp phase transition.
Low noise
Failure rises when informed traders are weak and adversarial pressure increases.
Medium noise
Strong informed traders remain safe, while weak-informed cells stay fragile.
High noise
Failure becomes universal: P(failure) = 1.0 across the full grid. At that point, adversary strength no longer matters.
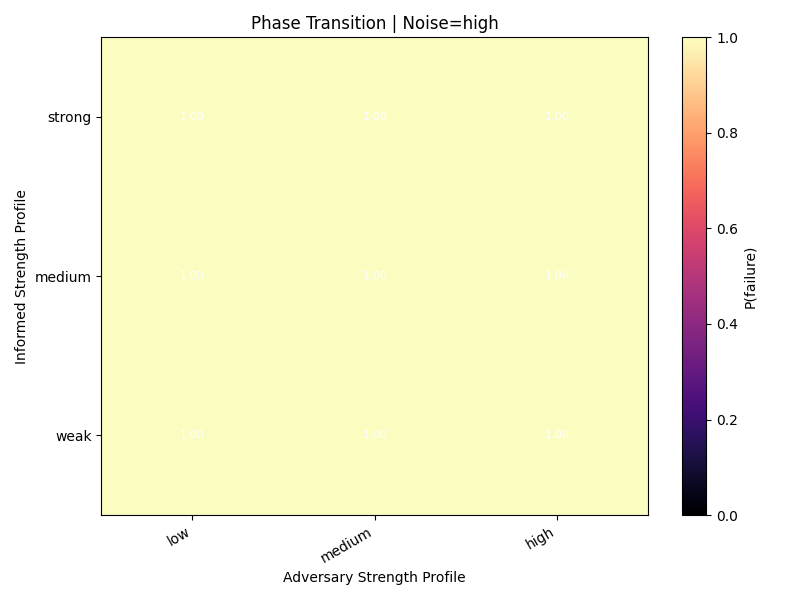
The worst raw cell in the rerun was noise = high, adversary = low, informed = weak, with:
- failure rate:
1.000 - avg p95 KL:
1.0297 - gate-pass rate:
0.000
6. Gating diagnostic
A realized-influence gate reframes the apparent adversarial boundary. A run counts as true adversarial stress only if adversary activity, executed notional share, and acceptance ratio all clear the thresholds.
Many high-failure cells had a gate-pass rate of 0.0, meaning they failed economically without strong realized adversarial control. Calling these cells “adversarial breakdowns” would be misleading.
True adversarial stress corner
- noise: low
- adversary: high
- informed strength: weak
- gate-pass rate:
0.600 - failure rate:
1.000 - avg adversary notional share:
0.351
This is the clearest case where manipulation is both active and economically meaningful.
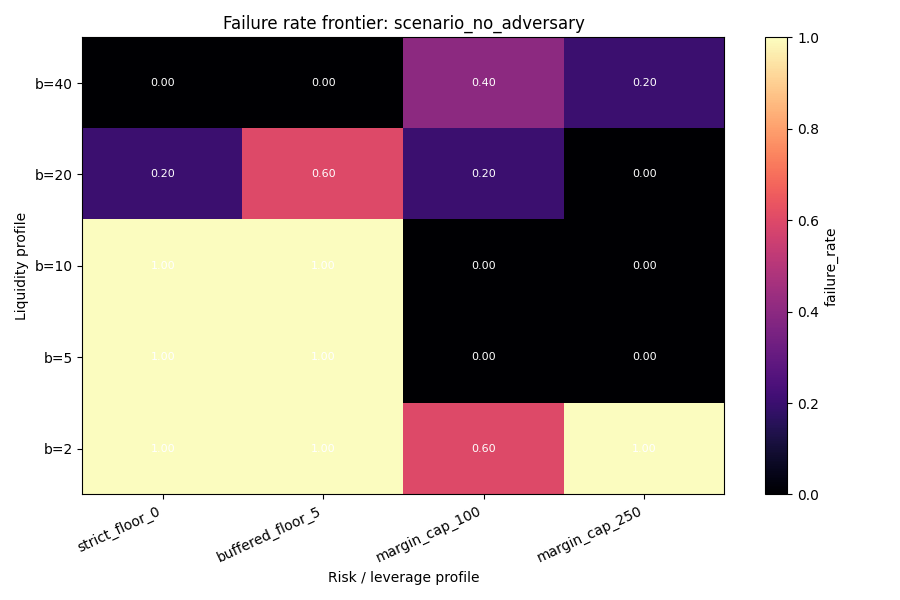
7. Liquidity × solvency frontier
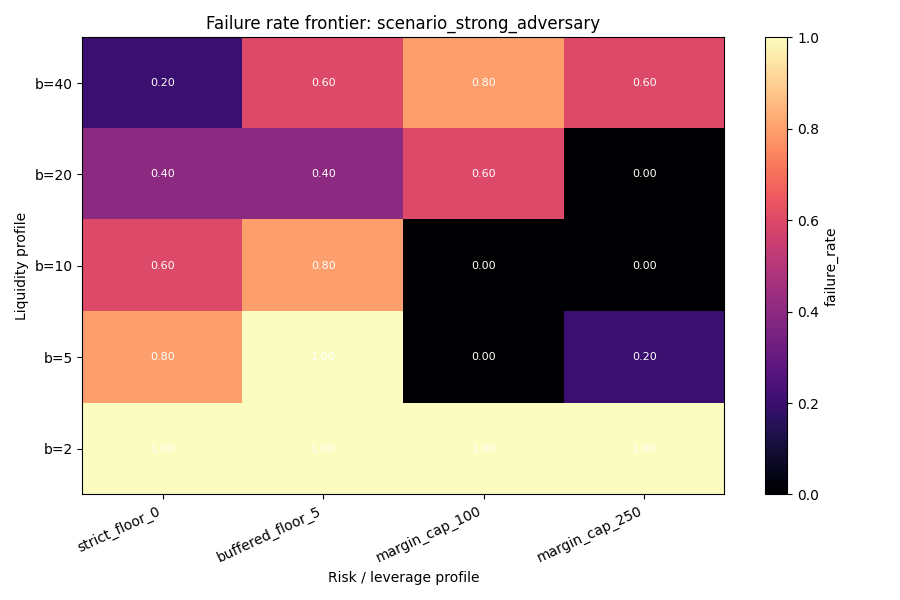
High liquidity and solvency floors produced the cleanest safe region.
Safest overall cells
- scenario:
no_adversary - liquidity:
b = 40 - risk profile:
strict_floor_0 - safe-seed rate:
1.000 - composite failure:
0.000 -
avg p95 KL:
0.0422 -
scenario:
no_adversary - liquidity:
b = 40 - risk profile:
buffered_floor_5 - safe-seed rate:
1.000 - composite failure:
0.000 - avg p95 KL:
0.0516
Best safe cell under strong adversarial pressure
- scenario:
strong_adversary - liquidity:
b = 40 - risk profile:
strict_floor_0 - safe-seed rate:
1.000 - composite failure:
0.200 - avg p95 KL:
0.0188
Margin profiles
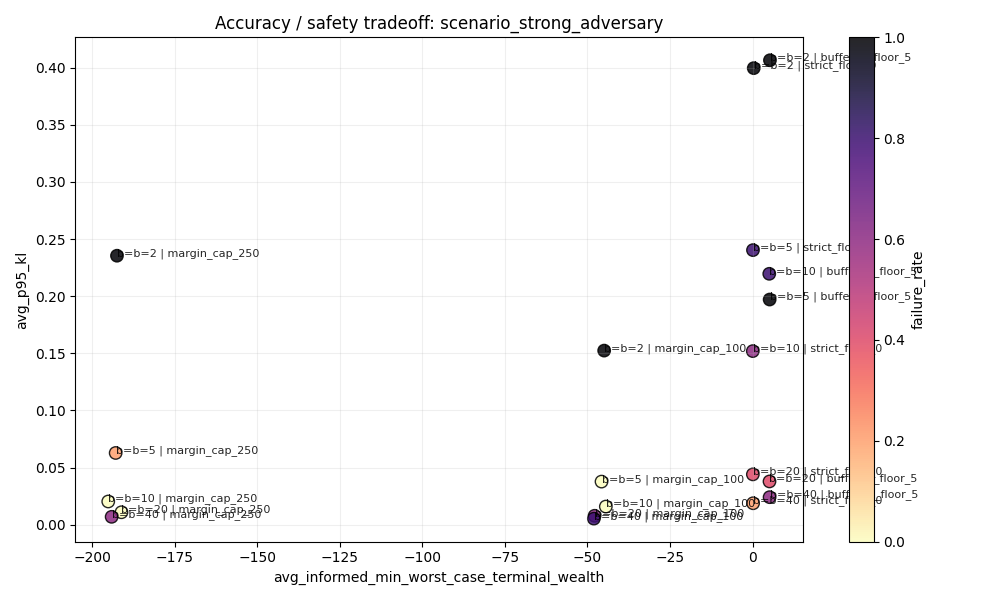
Margin-based profiles never produced a safe cell. Under strong_adversary, the most accurate margin cell still showed:
- risk profile:
margin_cap_100 - avg p95 KL:
0.0053 - informed worst-case terminal wealth:
-48.071 - composite failure:
1.000
Thus, low error alone did not imply safety.
8. Accuracy × safety
Solvency floors outperform margin caps when both accuracy and survival matter.
The most effective protections are structural:
-
Deeper liquidity
Reduces price impact per trade. -
Solvency floors
Create the only fully safe region in the rerun. -
Separate accuracy from safety
Some margin cells look accurate onp95_klbut still fail because informed traders can end with deeply negative worst-case wealth.
The broader implication is that the best protection comes from controlling market physics—price impact and bankruptcy—not from subtle fee tweaks.
9. Defense ablation
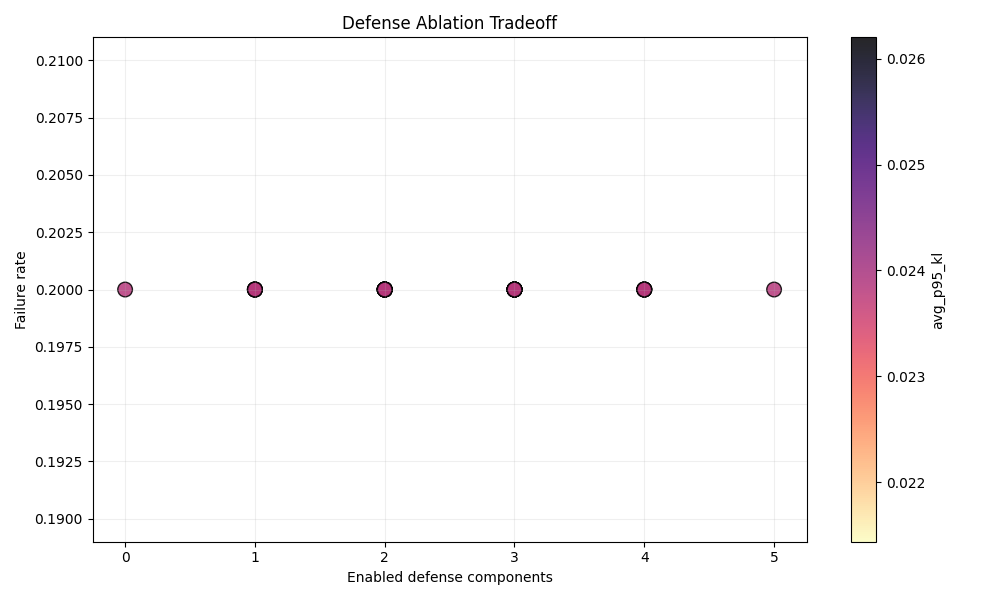
All 32 defense combinations converged to the same aggregate result in the live rerun.
Aggregate outcome across every combination
- failure rate:
0.200 - avg p95 KL:
0.0238 - avg fill rate:
0.2773 - combinations meeting a
0.10target failure rate:0
Likely interpretation
Under the current stressed default state, the tested toggles do not separate outcomes at the aggregate level. Either the base regime dominates the defense levers, or the summary metrics are too coarse to reveal narrower benefits.
Discussion
The main result contradicts the default intuition that adversaries are the dominant threat.
Expected vs observed
Robustness work often treats manipulation as the central risk. In these simulations, that is not what happens. Several adversarial scenarios perform well, and the realized-influence gate shows that many apparent adversarial failures are actually economic failures with low adversary participation.
Why this happens
The main bottleneck is information quality. Markets fail when:
- informed signals are stale
- noise becomes dominant
- endogenous technical behavior distorts price discovery
LMSR aggregates well only when informed flow dominates the order stream.
What the defenses show
Behavioral nudges such as fee toggles were weak here. By contrast, liquidity depth and solvency floors created clear safe regions. The most effective interventions therefore act on market structure, not just trader incentives.